
Introduction: The Art of Packing Smart Data Suitcases
Imagine you’re packing for a long trip. You could throw everything into one giant suitcase—shirts, chargers, shoes, and snacks—but that would make it heavy, hard to find things, and impossible to carry. Instead, you cleverly pre-pack certain combinations—say, a “work outfit” bag or a “gym essentials” pouch. Suddenly, travel becomes effortless.
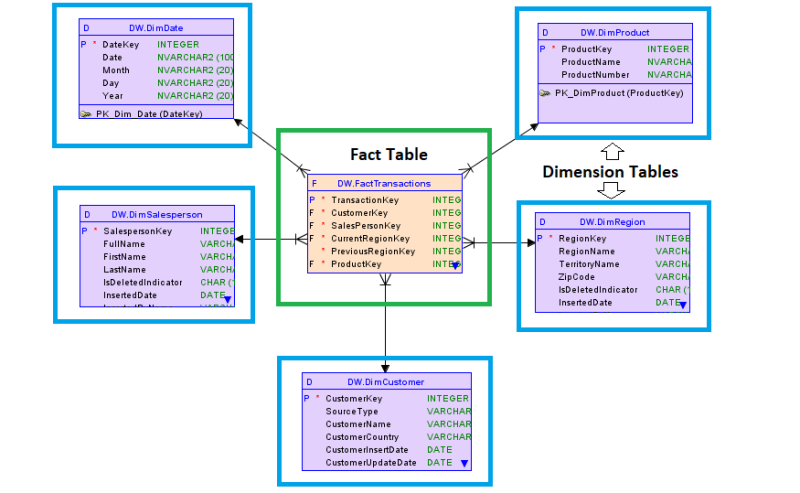
In the world of data warehousing, fact tables are those giant suitcases holding the measurable events of a business—sales, clicks, transactions, and more. Over time, these tables can become bloated, slowing down queries and clogging systems. The smart “packing trick” that keeps data nimble is the minidimension—a method of pre-calculating and storing combinations of frequently changing, highly correlated attributes. It’s like bundling related details together before the trip, so your analytics journey stays smooth.
1. Why Fact Tables Become Data Black Holes
Every data warehouse begins with optimism: store everything, analyze anything. But as months roll by, fact tables grow monstrously large. Imagine a retail store logging millions of transactions daily, each recording attributes like customer demographics, location, time, product, and discount tiers. Some of these attributes—like “loyalty tier” or “promotion level”—change often and are highly correlated.
When these variables are recorded in the fact table for every single transaction, it creates redundancy and bloat. Queries slow down, storage costs soar, and performance tuning becomes a nightmare.
Minidimensions step in like data librarians—organizing the chaos by grouping together dynamic attributes that frequently appear together. They reduce storage size and simplify query logic without losing analytical depth. This is a concept every professional exploring a data analyst course in Pune would appreciate when designing efficient data models.
2. The Birth of the Minidimension: A Tale from Retail Analytics
Let’s visit a major fashion retailer. Their analytics team noticed that customer behavior attributes—such as “membership level,” “preferred store,” “discount sensitivity,” and “purchase frequency”—changed so often that their fact table ballooned in size.
The team adopted a minidimension approach. They created a separate table to store these volatile, correlated attributes. Each unique combination received a small surrogate key—like a travel pouch label. The fact table now only referenced this compact key instead of storing all four attributes repeatedly.
The result? Fact table size reduced by nearly 35%, query performance improved, and data analysts could segment customers in real-time. It was like turning an overstuffed suitcase into a neatly packed carry-on.
This approach reflects the kind of applied thinking nurtured in a data analytics course, where learners practice optimizing systems not just for accuracy, but for elegance and scalability.
3. Case Study 1: Telecom and the Dynamic Customer Profile
A leading telecom provider faced an overwhelming challenge: their billing fact table was exploding. Each customer interaction—call, data usage, message—carried dozens of descriptive attributes like “plan type,” “roaming status,” “promotion eligibility,” and “contract phase.” These attributes frequently changed as customers switched plans or crossed data limits.
Instead of duplicating this information across billions of rows, the data engineering team built a minidimension that encoded correlated attributes into compact profile combinations. Each transaction in the fact table pointed to one minidimension record rather than carrying all the details.
The impact was dramatic. Storage costs dropped by 40%, queries executed 50% faster, and customer behavior analysis became smoother. The approach turned a once-bloated system into a streamlined analytical powerhouse—proof that smart design can beat raw horsepower.
4. Case Study 2: Healthcare and the Evolving Patient State
In healthcare analytics, patient conditions can change by the hour—vitals, medications, ward transfers, and treatment plans. A hospital’s analytics platform struggled with a fact table that recorded every change, resulting in endless repetition.
To solve this, the team introduced a minidimension to capture correlated attributes such as “ward type,” “medication regime,” “risk level,” and “attending physician.” Each distinct state combination was assigned an identifier, referenced in the fact table whenever a patient record was updated.
Suddenly, tracking a patient’s journey became far easier. Reports loaded faster, dashboards updated seamlessly, and analysts could focus on care outcomes instead of query optimization. The minidimension had quietly stitched order into the chaos of healthcare data.
5. Case Study 3: Finance and the Market Sentiment Snapshot
A financial analytics firm monitoring daily trading behavior found that market sentiment, trading volume, and sector volatility were highly correlated. Each trading record repeated these metrics across billions of rows.
By implementing minidimensions, they grouped these correlated attributes into “sentiment clusters.” Each cluster represented a unique combination of market mood and volatility index, referenced in the fact table. The overall data footprint reduced significantly, while trend analysis became faster and more interpretable.
This innovation exemplified the future-facing mindset promoted by professionals in a data analyst course in Pune—combining technical efficiency with analytical foresight.
Conclusion: The Quiet Revolution of Compact Intelligence
Minidimensions don’t shout innovation—they whisper it. They are the quiet organizers behind efficient data warehouses, making analytics faster, cleaner, and lighter. By pre-calculating and storing correlated attributes, they reduce redundancy while preserving analytical depth.
In a world obsessed with “big data,” minidimensions teach us the value of smart data—data that’s well-packed, well-labeled, and ready for the journey ahead. Whether you’re designing systems in retail, telecom, or healthcare, this technique helps you think beyond size and focus on structure.
For those pursuing a data analytics course, mastering such architectural finesse is essential—not just to manage data, but to elevate it into insight. Because in the end, it’s not about how much data you store—it’s about how elegantly you can unpack it.
Business Name: ExcelR – Data Science, Data Analytics Course Training in Pune
Address: 101 A ,1st Floor, Siddh Icon, Baner Rd, opposite Lane To Royal Enfield Showroom, beside Asian Box Restaurant, Baner, Pune, Maharashtra 411045
Phone Number: 098809 13504
Email Id: enquiry@excelr.com


+ There are no comments
Add yours